NOVOCIB provides advanced analytical services
using an enzymatic approach coupled to ion-paired high-performance liquid chromatography
(HPLC-UV) for complete characterization of Total Potentially Available Nucleotides (nucleotides, nucleosides, bases,
and nucleic acids) present in microbial biomass, single-cell protein (SCP), food, feed, and biological samples.
Find more about Analytical Principles of our Method here.
#REF
PRODUCT NAME
PRICE
#S1200-01-SOL
Full spectra of soluble purine and pyrimidine nucleotides, including bases (adenine, guanine, hypoxanthine, cytidine, uracil), nucleosides (cytidine, uridine, guanosine, inosine, adenosine), and nucleotide monophosphates (CMP, UMP, GMP, IMP, AMP) analyzed by Ion paired reverse phase HPLC UV analysis.
Full spectra of soluble bases, nucleosides, NMP and RNA characterized by ion paired HPLC UV, with quantitative assessment of NMPs generated by nuclease digestion of RNA by comparative analysis before and after nuclease digestion of RNA to NMPs.
Total nucleic acid content (RNA and DNA), analyzed by nuclease digestion of RNA and DNA to corresponding NMPs and dNMPs, and quantitatively analysis by ion-paired reverse phase HPLC UV.
Full spectra of soluble bases, nucleosides, NMPs, RNA, and DNA characterized by ion paired HPLC UV, with quantitative assessment of NMPs and dNMPs generated by nuclease digestion of RNA and DNA.
Nucleotides are considered semi-essential nutrients, as endogenous synthesis does not always meet
physiological demand, particularly during periods of rapid growth, immune activation, or intestinal
repair. In infants, dietary nucleotide supplementation has been shown to enhance humoral antibody
responses to vaccination, as demonstrated by Pickering et al. (1998). In aquaculture, nucleotide-fortified
feeds are widely recognized to improve intestinal health, growth performance, immune competence, gut
integrity, and stress resistance in fish and shrimp.
On the other hand, nucleotides and nucleic acids are also a major source of purines, and excessive
human consumption may lead to overproduction of uric acid. This is particularly relevant for single-cell
proteins (SCP), a new sustainable alternative to animal or plant proteins. SCPs are produced from
fast-growing microbial biomass and purified by microfiltration, a process that concentrates not only
proteins but also polymeric DNA and RNA, resulting in high nucleotide content. FAO/WHO
recommended that SCP intended for human consumption should be processed to reduce nucleic acids to
~2% of dry matter, because high RNA intake increases purine load and uric-acid production.
To ensure compliance with nutritional and regulatory requirements, a new analytical method was
developed and validated to accurately quantify nucleotides and nucleic acids in complex matrices. The
method is applicable to nucleotide ingredients, yeast and SCP protein as well as final feed products,
enabling robust quality control and monitoring of purine load in formulations containing microbial
proteins.
Analytical Method Overview
NOVOCIB's analytical method integrates two complementary modern technologies to achieve accurate
quantification of free nucleotides, nucleosides, bases, and polymeric nucleic acids (RNA and DNA)
in complex biological ingredients and feed matrices.
Biological Sample
↓
IP-RP UV-HPLC analysis for bases, nucleoside and NMP
↓
Nuclease P1 digestion of RNA and DNA to NMP and dNMP
↓
IP-RP HPLC analysis for bases, nucleosides NMP, RNA-derived NMP and DNA-derived dNMP
Ion-Pair Reverse-Phase UV-HPLC (IP-RP HPLC–DAD) enables simultaneous
separation and quantification of bases, nucleosides, and nucleotides in a single analytical run.
Specific Nuclease Hydrolysis (Nuclease P1) performs complete and highly
specific digestion of RNA and DNA into ribo- and deoxy-monophosphate nucleotides (NMPs
and dNMPs), followed by comparative HPLC analysis.
Comparative Spectral Analysis — evaluation of IP-RP UV-HPLC spectra before
and after nuclease digestion allows precise calculation of total nucleic acids, free bases, free
nucleosides, and free nucleotides.
Analytical Standards
Since commercially available nucleobases, nucleosides, and nucleotide mono-, di-, and triphosphates
may contain unspecified amounts of residual salts and water, NOVOCIB verifies the true molar
concentration of each standard using published molar absorption coefficients (see tables below).
This verification step ensures a reproducible concentration of analytes from different sources for
the HPLC calibration. The integrity of every standard is controlled by HPLC analysis.
Table 1. Nucleotide monophosphates (NMP)
Compound
Λ max nm
ε max M-1cm-1
pH
CMP
272
9 000
7
UMP
262
10 000
7
GMP
250
14 200
7
IMP
248
12 300
N/C
AMP
259
15 400
7
N/C: not communicated
Table 2. Nucleobases
Compound
Λ max nm
ε max M-1cm-1
pH
Cytosine
267
6 100
8.8
Uracil
259
8 200
7
Guanine
275
8 100
6.2
Hypoxanthine
248
10 700
N/C
Adenine
260
13 400
N/C
Xanthine
271
9 200
7.5
N/C: not communicated
Table 3. Nucleosides
Compound
Λ max nm
ε max M-1cm-1
pH
Cytidine (CR)
271
9 100
8.2
Uridine (UR)
261
10 100
7.3
Guanosine (GR)
252
13 700
5.5–7
Inosine (IR)
249
12 200
6–7.5
Adenosine (AR)
260
15 100
N/C
Xanthosine (XR)
249
11 400
8
N/C: not communicated
How to check the concentration of purified nucleotide by absorbance
Prepare a 100 mM stock solution in autoclaved deionized water* using the molecular weight provided by the supplier.
Choose the appropriate wavelength on the UV-spectrophotometer.
Make a blank using a quartz 1-cm cuvette (plastic cuvettes must not be used for short-UV wavelengths) filled with a buffer of the desired pH.
Prepare a 0.05 mM (50 µM) solution of the nucleotide in the same buffer**.
Measure the absorbance of the 50 µM solution.
Compare the obtained absorbance value with the molar extinction coefficient (ε) to calculate the actual analyte concentration.
* Some nucleosides and bases are insoluble in water but can be dissolved in 0.1–0.5 M KOH. ** Intermediate dilutions may be required to prepare a 50 µM solution from a 100 mM stock.
Example — IMP concentration check:
Prepare 100 mM inosine-5'-monophosphate (IMP) by dissolving 392 mg of powder in 1 mL of water (Ref. I4625).
Select 248 nm as the detection wavelength on the spectrophotometer.
Prepare a 1 mM IMP solution (1:100 dilution of the 100 mM stock) and a 50 µM IMP solution (1:20 dilution of the 1 mM solution).
Measure the absorbance of 50 µM IMP solution at 248 nm using a quartz 1-cm cuvette (plastic cuvettes must not be used for short-UV wavelengths).
If, for example, the absorbance at 248 nm is 0.375 AU (instead of 0.615), this corresponds to an actual concentration of 30.5 µM instead of 50 µM IMP.
If you have questions about preparing nucleotide standards at exact concentrations, please
contact us.
Quality Control Sample
To avoid any loss of bases, nucleosides, or nucleotides during the pretreatment step, sample
preparation is limited to solubilization in sterile deionized water followed by deproteinization
and injection into the ion-paired reverse-phase (IP-RP) HPLC system, allowing direct separation
and quantification of the whole spectrum of bases, nucleosides and nucleotides present in the
sample (Fig. 9).
A powder of concentrated nucleotides, a commercial product derived from Saccharomyces
cerevisiae (26.2 g/100 g according to the supplier and 31.1 g/100 g according to NOVOCIB), is
used as a Quality Control Sample run immediately after standards STD1 (NMP), STD2 (Nucleosides)
and STD3 (Bases), both before and after the analyzed samples.
Table 7 presents the nucleotide quantification results obtained using NOVOCIB's IP-RP method
compared with the manufacturer's data. For purine NMPs — AMP, GMP and IMP — the values are
similar. In contrast, NOVOCIB's values for the pyrimidine nucleotides UMP and CMP are higher,
most likely because pyrimidine nucleotides are not degraded under NOVOCIB's conditions, unlike
during acidic hydrolysis. Table 8 shows the relative standard deviations of peak area for the
Quality Control Sample analyzed six times, together with the acceptance criteria (Fig. 9).
Table 7. Nucleotide content per 100 g (S. cerevisiae concentrate)
Compound
NOVOCIB g/100g
Acid Hydrol. g/100g
Cytosine
0.00
—
Uracil
0.17
—
Guanine
0.00
—
Hypoxanthine
0.00
—
Adenine
0.18
—
Cytidine
0.34
—
Uridine
0.85
—
Guanosine
1.91
—
Inosine
0.00
—
Adenosine
1.62
—
CMP
6.10
5.00
UMP
7.83
5.00
GMP
8.86
8.00
IMP
0.00
0.20
AMP
8.27
8.00
Total 5'-NMP
31.07
26.2
CMP–AMP rows given without salt/water.
Table 8. QC repeatability (% RSD)
Compound
% RSD n=6
Criteria
CMP
1.3%
<5%
UMP
2.3%
<5%
GMP
2.5%
<5%
IMP
2.2%
<5%
AMP
2.2%
<5%
All compounds meet the <5% acceptance criterion.
All compounds meet the <5% acceptance criterion.
Fig. 9: Chromatogram superposition of a Saccharomyces cerevisiae-derived nucleotide-concentrated commercial product at 254 nm (blue line) and 280 nm (red line).
Chromatogram superposition of a Saccharomyces cerevisiae-derived nucleotide-concentrated commercial product at 254 nm and 280 nm
Method Performance
Selectivity
Selectivity of this method is ensured by the excellent separation of nucleotides, achieved through
the high purity of the TBA ion-pairing reagent, its optimized concentration in buffers A and B,
and the superior performance of the Zorbax Eclipse Plus C18 column (Agilent).
Specificity
Specificity of this method relies on accurate nucleotide identification by comparing retention times
and UV absorption spectra (254/280 ratio), which are characteristic for each nucleotide. Spectra at
254 nm and 280 nm are recorded using a diode-array detector (Agilent). Run control and data
acquisition are performed using Agilent ChemStation software.
Fig. 1: Chromatogram of 15 mixed standard solutions of nucleobases, nucleosides and NMP (250 nm).
Chromatogram of 15 mixed standard solutions of nucleobases, nucleosides and NMP at 250 nm
Fig. 2: Superposition of spectra at 254 nm (blue) and 280 nm (red) with 254/280 area ratio indicated for each nucleotide.
Superposition of UV spectra at 254 nm and 280 nm for 15 mixed standards of nucleobases, nucleosides and NMP with 254/280 area ratio
Linearity and Repeatability
Linearity and repeatability were evaluated using three independent calibration curves prepared from
mixtures of standards: STDB1 (CMP, UMP, GMP, IMP, AMP), STDB2 (cytosine, uridine, guanosine,
inosine, adenosine), and STDB3 (adenine, guanine, hypoxanthine, cytidine, uracil). Each mixture
was analyzed at the indicated concentrations, with six repeated measurements per level. Tables 4–6
summarize the coefficients of determination for all calibration curves and the relative standard
deviations of peak areas obtained at the lowest tested concentration (25 µM) for nucleotides,
nucleosides, and bases. All compounds exhibited good linearity, with the highest correlations
observed for 5'-NMP, which represents the primary focus of this study.
Table 4. Coefficients of determination obtained with calibrated standards solutions of nucleotides monophosphates
Composition
Linearity (r²)
% RSD
CMP
0.9998
10.5%
UMP
0.9994
0.9%
GMP
0.9999
3.1%
IMP
0.9999
6.8%
AMP
0.9999
1.2%
XMP
0.9999
2.5%
STD1 (NMP), 25–500 µM, peak area at 254 nm.
Fig. 3: Superposition of HPLC chromatograms of six nucleotide standards—AMP, GMP, IMP, CMP, UMP, and XMP—run at concentrations 25 to 500 µM, all detected at UV 254 nm.
Superposition of HPLC chromatograms of six nucleotide monophosphate standards
Fig. 4: Calibration curves (254 nm) for six NMP showing linear peak-area responses for CMP, UMP, GMP, IMP, AMP, and XMP.
Calibration curves for six nucleotide monophosphates showing linear peak-area responses
Table 5. Coefficients of determination obtained with calibrated standards solutions of nucleosides
Composition
Linearity (r²)
% RSD
Cytidine
0.9995
0.9%
Uridine
0.9997
2.8%
Guanosine
0.9999
11.7%
Inosine
0.9999
13.6%
Adenosine
0.9997
2.8%
Xanthosine
0.9999
2.8%
STD2 (Nucleosides), 25–500 µM, peak area at 254 nm.
Fig. 5: Superposition of HPLC chromatograms of six nucleoside standards—adenosine, guanosine, uridine, cytidine, inosine and xanthosine—run at concentrations 25 to 500 µM, all detected at UV 254 nm.
Superposition of HPLC chromatograms of six nucleoside standards
Fig. 6: Calibration curves (254 nm) for six nucleosides showing linear peak-area responses for adenosine, guanosine, uridine, cytidine, inosine and xanthosine.
Calibration curves for six nucleosides showing linear peak-area responses
Table 6. Coefficients of determination obtained with calibrated standards solutions of bases
Composition
Linearity (r²)
% RSD
Adenine
0.9998
2.8%
Guanine
0.9999
0.4%
Hypoxanthine
0.9995
3.5%
Cytosine
0.9994
5.9%
Uracil
0.9991
10.0%
Xanthine
0.9994
1.2%
STD3 (Bases), 25–500 µM, peak area at 254 nm.
Fig. 7: Superposition of HPLC chromatograms of six nucleobase standards—adenine, guanine, uracil, cytosine, hypoxanthine and xanthine—run at concentrations 25 to 500 µM, all detected at UV 254 nm.
Superposition of HPLC chromatograms of six nucleobase standards
Fig. 8: Calibration curves (254 nm) for six nucleobases showing linear peak-area responses for adenine, guanine, uracil, cytosine, hypoxanthine and xanthine.
Calibration curves for six nucleobases showing linear peak-area responses
Our analytical system
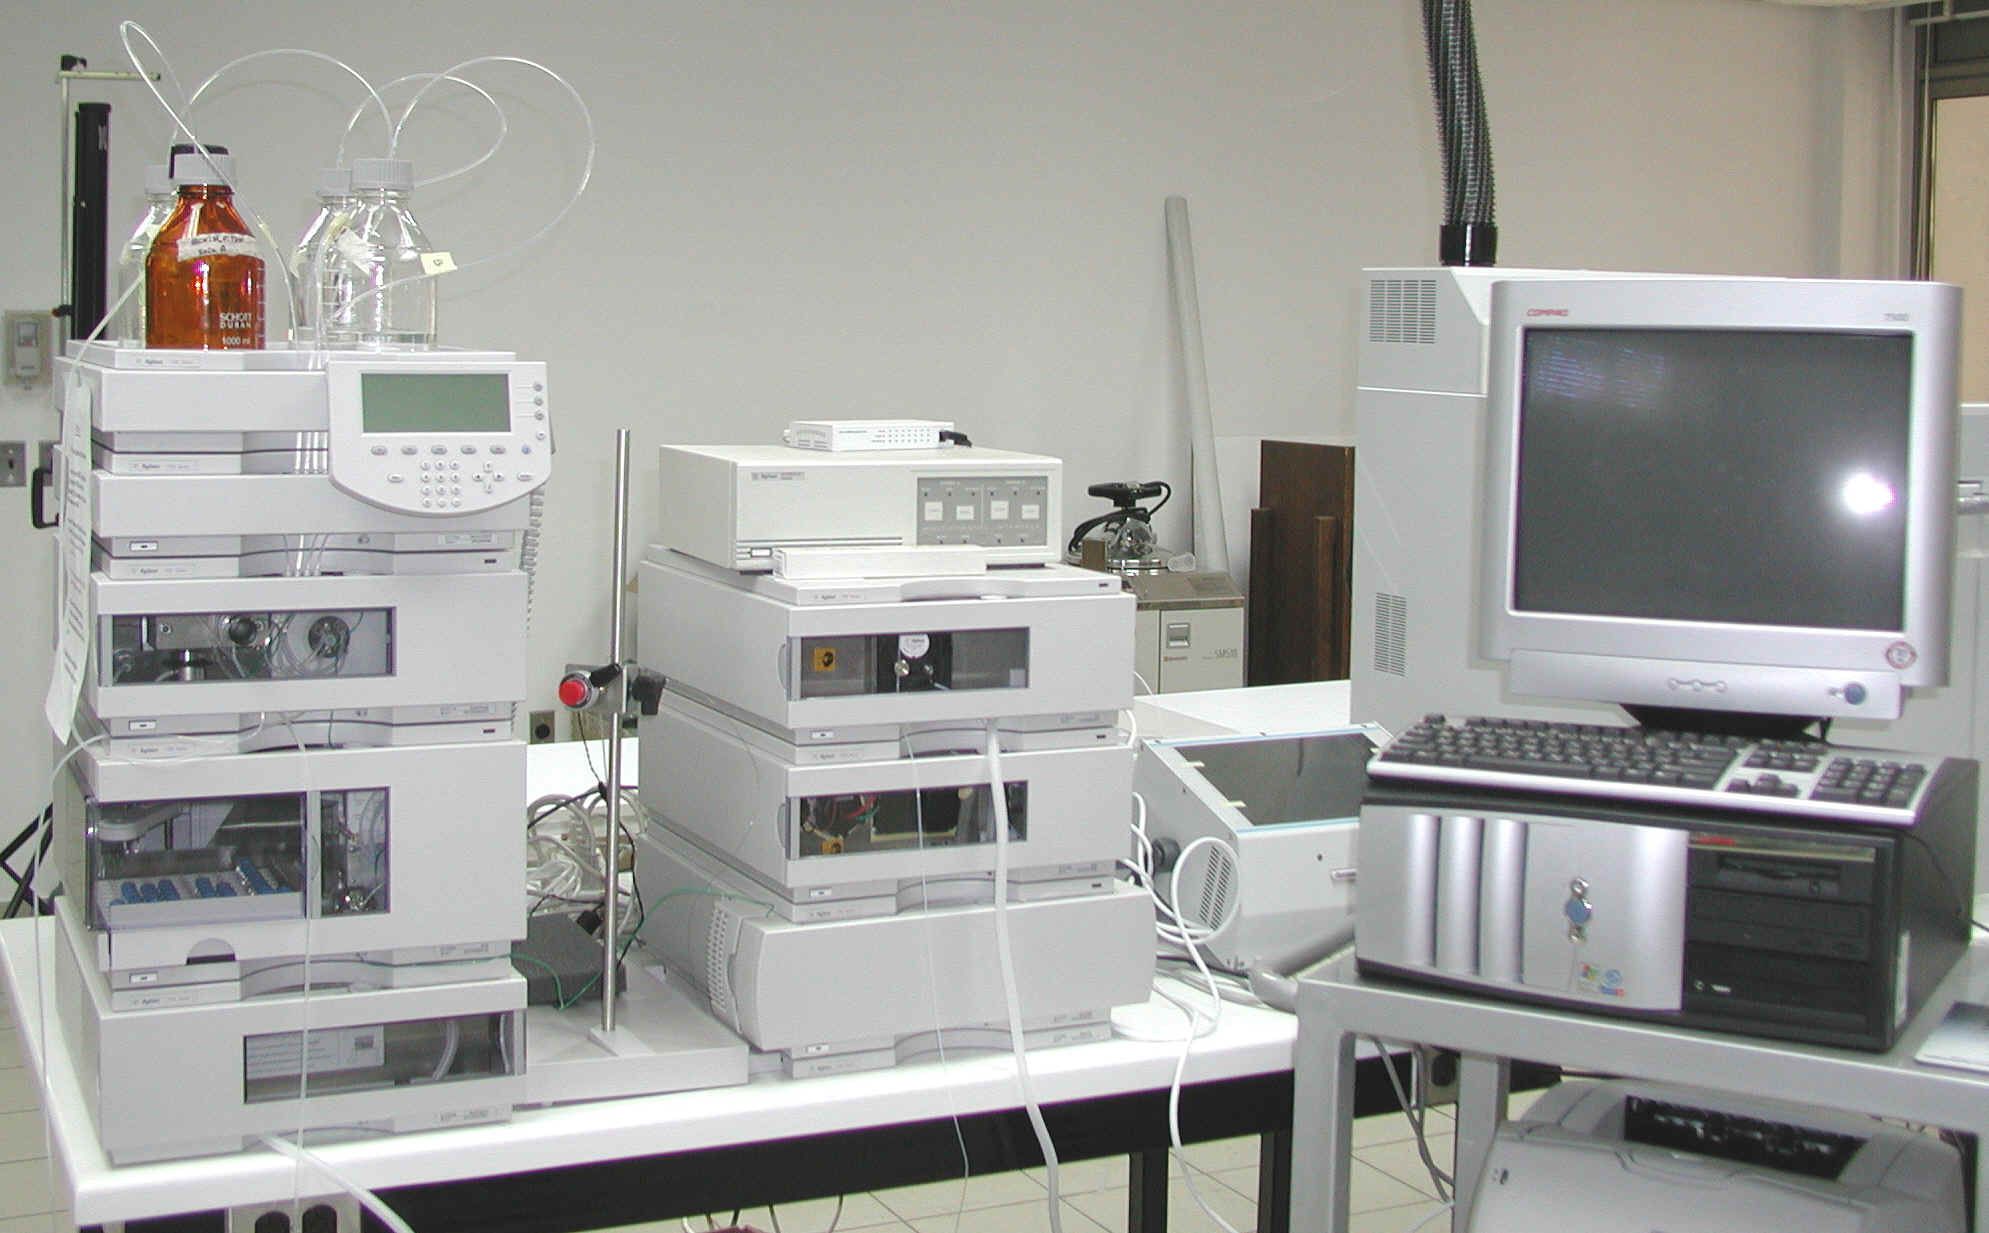
Agilent 1120 series HPLC liquid chromatograph fitted with binary pump,
vacuum degasser, well-plate autosampler, thermostatic column compartment
and multiple wavelength and diode array detector. Run and data
acquisition are controlled by Agilent Chem Station software.
Calibrations are performed with standards prepared in mobile phase and
with standards mixed with cell extracts, which are run immediately
before and after every series of samples. Peak assignment of different
bases, ribonucleosides and ribonucleoside monophosphates is done by
comparing both retention times and characteristics of UV absorption
spectra (254/280 ratio) with those of standards. The area of individual
peaks was measured using ChemStation software (Agilent).
Photo of HPLC system used for nucleotide analysis.
Frequently Asked Questions
Enzymatic hydrolysis preserves the distinction between free nucleotides and polymeric nucleic acids, which improves compositional interpretation. Acid hydrolysis is fast, but it collapses multiple compound classes into free bases.
The service quantifies free bases, nucleosides, nucleotide monophosphates (AMP, GMP, IMP, CMP, UMP), and nucleic acids (RNA and DNA), depending on the selected package.
In most workflows, yes. Enzymatic hydrolysis generally reduces hazardous corrosive waste relative to strong-acid hydrolysis and simplifies waste management.